Force Directed Graph Visualizations
Data is eating the world, graphs help up us digest it. They allow us to contextualize big data, and in the process, enable businesses to de-risk at every stage and put data behind all assumptions - big and small. Fewer blind spots enable bolder decision making at every level and function.
We use graphs every day. Google search and your favorite social network are powered by graphs. There’s good reason, graphs are highly effective at storing large disparate data sets. Most of the graphs we use today are hidden in plain sight, for many it may seem hard to imagine how you would visualize something like search results differently from a list. Graphs and the way we display their data can vary greatly. I'd argue that certain graph visualization layouts, like force directed layouts, help turn data into knowledge.
Graph algorithms: Analysis vs. Visualization
The below algorithms lay the required foundation for impactful graph visualizations. They allow us to cluster and predict but to visualize graphs we must rely on specific graph drawing algorithms to display data in a useful and visually appealing way.

Graphs are frequently drawn as node–link diagrams in which the nodes are represented as disks, boxes, or textual labels and the links are represented as line segments or curves in the Euclidean plane. Many different quality measures have been defined for graph drawings, in an attempt to find objective means of evaluating their aesthetics and usability. Why do graphs need their own set of unique algorithms for visualizing the data?
More data more problems
Graph data readability can succer significantly when working with highly connected big data. The challenge is displaying the right amount of contextualized data and clusters while still being useful. can often become unreadable with the increase in data points being plotted. Here's some considerations when visualizing graph data:
- Understandability
- Usability
- Fabrication cost
- Aesthetics
Which of the layouts is more useful?
Both visual layouts use the same data.

Vs.

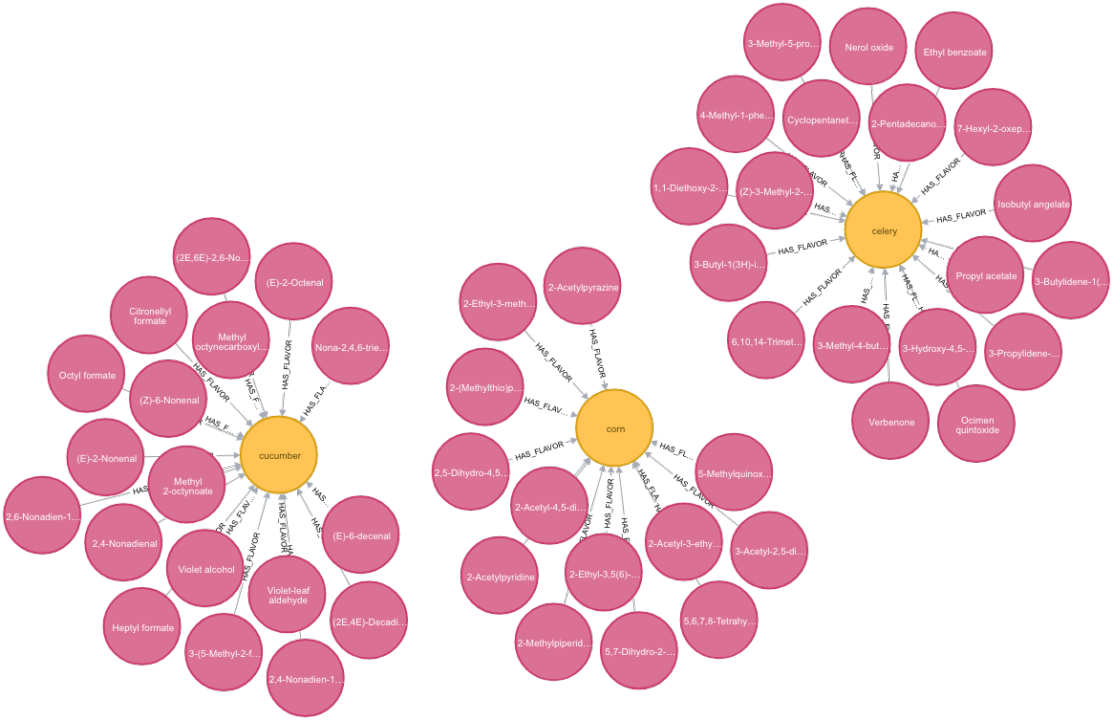
Force Directed Graph Layouts
My personal favorite is the force directed layout systems where the graph is being drawn based on a system of forces related to springs and molecular mechanics. There’s ~6 noteable graph layout systems with many focusing on specific applications such as bioinformatics or mapping software systems.
Force directed layout systems act similar to gravity - they combine attractive forces between adjacent nodes with repulsive forces between all pairs of nodes, in an attempt to produce a layout in which link lengths are small while nodes are well-separated. Some force directed systems may perform gradient descent based minimization of an energy function, or they may translate the forces directly into velocities or accelerations for the moving vertices.

Graphs contextualize data, graph visualizations help us turn that data into knowledge. When working with graphs be sure to choose the appropriate graph visualization and layout for the business objective!