


Colloquial LED color names can be deceiving.By Michael Royer, Jason Livingston and Jess Baker
White LEDs are typically described based on correlated color temperature (CCT), chromaticity, chromaticity consistency, color rendition, efficacy, luminous flux and electrical characteristics. Color LEDs introduce additional characterizations that are likely less familiar to architectural lighting practitioners. If the prevalence of color-mixed LED systems increases, as is expected over the next decade due to efficacy gains, practitioners and users will have to become familiar with the intricacies of choosing, specifying, controlling and maintaining such systems.
Colloquially, color LEDs are referred to by color names. Common names include violet, blue, cyan, green, lime, amber, red-orange and red. Others include indigo, royal blue, true green, mint, yellow, orange, super red, far red, deep red, photo red and more. An obvious challenge is that the resolution of color names in the English language is insufficient for creating small enough performance bins for practical use, and presently there is no standard that defines what specification corresponds to what name.
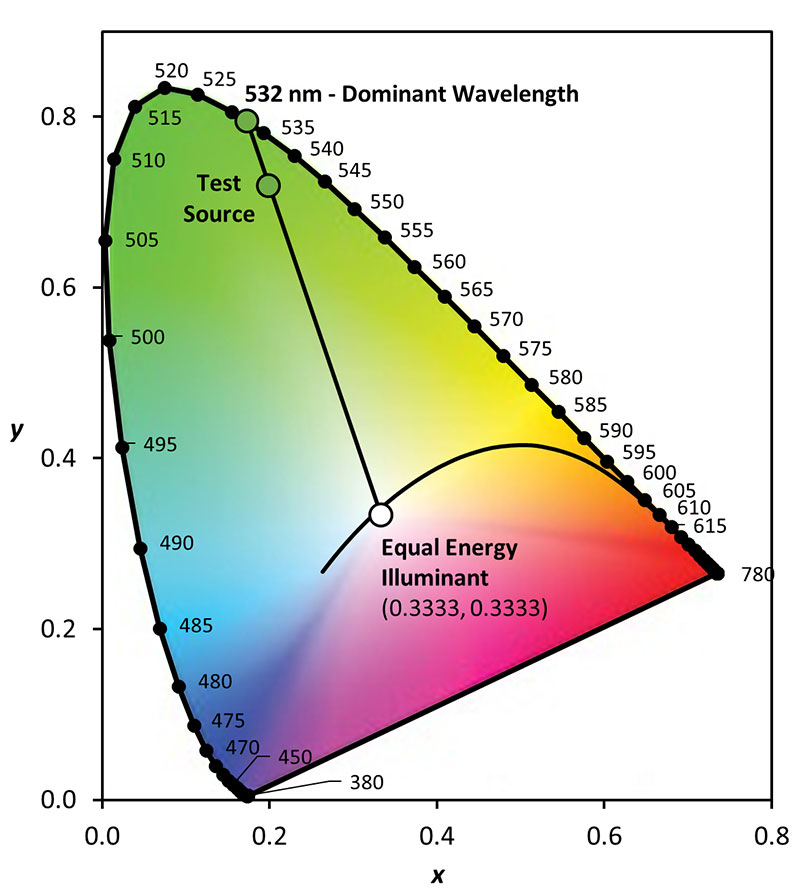
One way the “color” of color LEDs is often quantified, as when producers bin products, is dominant wavelength, which is defined by IES as: “The wavelength of radiant energy of a single frequency that, when combined in suitable proportion with the radiant energy of a reference standard, matches the color of the light.” The reference standard is typically the equal energy illuminant, and the 1931 chromaticity diagram is typically used for calculation. As shown in Figure 1, dominant wavelength is where the extension of the line between the chromaticity of the equal energy illuminant and that of the light source intersects the spectrum locus. In many uses, dominant wavelength has substantial limitations; like CCT, it is a one number simplification, such that two products with the same dominant wavelength could have different chromaticities, spectral power distributions (SPDs), etc.
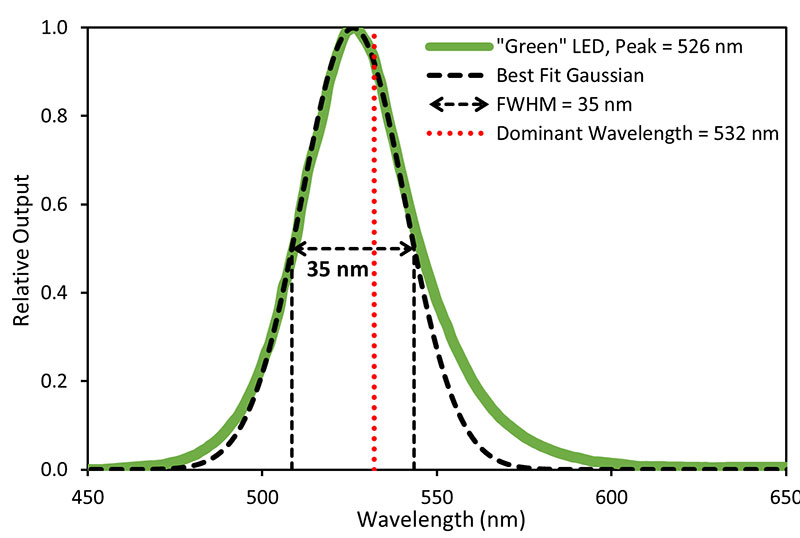
Although it is also a one-number simplification, some users prefer peak wavelength, which is defined as the wavelength at which the most radiant energy is emitted. Peak wavelength can be paired with full-width-half maximum (FWHM), or the width of the SPD in nanometers where the radiant power is half of the peak, to allow for simulation if the distribution is treated as perfectly Gaussian (a mathematical “bell curve”). In reality, the emission of color LEDs is not perfectly Gaussian, nor is it monochromatic, which is a common misconception. Figure 2 demonstrates these concepts.
Sometimes dominant wavelength is reported, sometimes peak wavelength, or sometimes both, which can make comparisons difficult. There’s also centroid wavelength, although it is much less frequently reported. The differences in reported data, either within or between manufacturers, may stem from different target audiences, such as architectural, horticultural or machine vision applications.
Color LEDs can also be described with chromaticity coordinates, which provide additional detail compared to dominant wavelength and peak wavelength. An SPD provides complete detail, although it can be difficult to predict differences in performance from visual evaluation of SPDs, and graphical representations require processing to calculate metrics.
Another key performance attribute is the amount of emitted light, which is sometimes reported as radiant power (total watts across the visible spectrum) and sometimes reported as luminous flux (watts weighted by the luminous efficiency function,
Vλ). Likewise, energy efficiency may be reported as conversion efficiency (percentage of electrical power converted to radiant power) or luminous efficacy (lumens per watt). Again, the variation in reporting often stems from different target uses.
As with white LEDs, having the same color name is no guarantee of equivalent performance. For example, blue LEDs may have dominant wavelengths ranging from 460 to 485 nm, whereas royal blue can have dominant wavelengths between 440 and 465 nm. While red LEDs have a tighter range of reported dominant wavelengths from different manufacturers (typically 620 to 634 nm), the naming and performance of longer-wavelength LEDs is considerably less uniform.
TRADITIONAL METRICS LIKE CRI have tended to be less sensitive to relatively small changes in an SPD, such as a small peak wavelength shift occurring with LEDs of the same color name. That is, large tolerances would maintain the same rated performance. However, modern metrics like TM-30’s Rf better represent visual perception and are more sensitive to such changes. Swapping LEDs with the same color name within a mixture can result in up to a 10-point difference in Rf. This scenario could easily occur when specifying multiple color-mixed LED products for one space, or when replacing a failed unit. Simply specifying two red-green-blue-amber (RGBA) products, for example, does not guarantee a match in chromaticity, color rendition or alpha-opic quantities. Also note that common acronyms like RGB do not necessarily mean LEDs with the associated names will be included— for example, the “B” LED may actually be what is typically called royal blue.
Luminaire producers may also address consistency. When incorporated into color-mixed systems, variation among LEDs is sometimes addressed with factory tuning/calibration of the complete system, or with active feedback from sensors. These strategies can have varying levels of success depending on the implementation, and how much variation is acceptable over different metrics, because not all can be prioritized.
The amount of visible mismatch in chromaticity for tunable products can be surprising. It’s true that two systems with different LEDs can be set to deliver the same specific chromaticity—calculated according to a standard observer. However, differences in the metameric SPDs can mean the perceived chromaticity will not match for all observers in a group. Even greater differences in performance may arise due to the algorithms used to create combinations at a specific chromaticity; that is, chromaticity can match but color rendition or alpha-opic quantities may not.
As with white LEDs, an important takeaway is that nominal names should not be expected to convey uniform performance. Tighter binning—down to at least 2.5 nm ranges—is sometimes available for some types of products and can be combined with system level techniques for reducing variability. Still, improvement in specification systems that address sample-tosample and product-to product variation across the full range of relevant metrics will help produce consistent, predictable results as color-mixed LED systems become more prevalent. Even then, specifiers will have to expand their understanding of these systems to weed out poor performers, and to protect their clients and their designs.