File:CIE 1931 Chromaticy Diagram and Gamut.jpg
Jump to navigation
Jump to search

Size of this preview: 800 × 436 pixels. Other resolutions: 320 × 174 pixels | 640 × 348 pixels | 1,024 × 558 pixels | 1,280 × 697 pixels | 2,564 × 1,396 pixels.
Original file (2,564 × 1,396 pixels, file size: 368 KB, MIME type: image/jpeg)
Captions
Captions
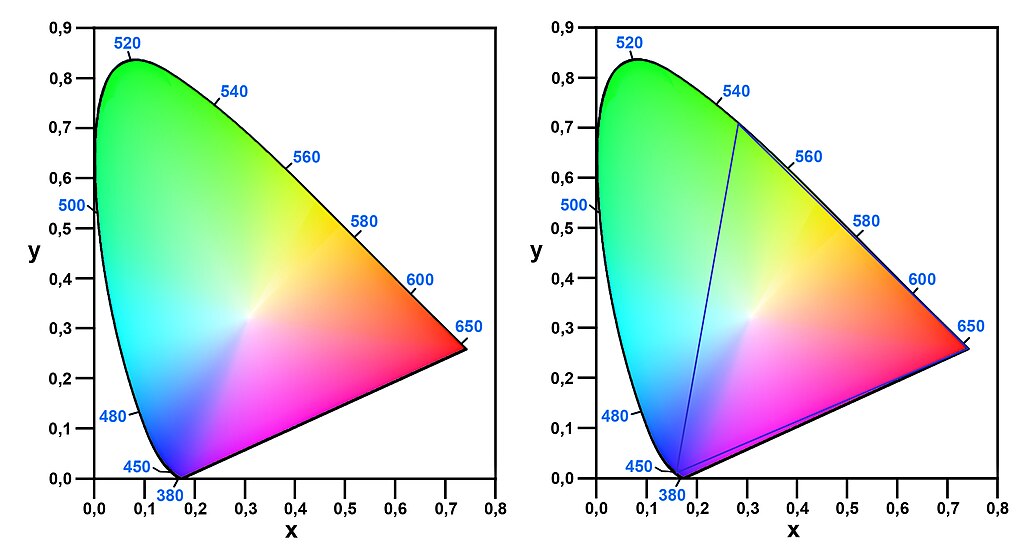
CIE 1931. Left: Chromaticity Diagram - Right: chromaticity of additive mixing of primaries
Summary[edit]
| Description |
English: Left: CIE 1931 Chromaticity Diagram.
Right: The triangle shows the chromaticity of colors that the additive mixing of CIE 1931 RGB stimuli can produce.
Italiano: SInistra: Diagramma di cromaticità CIE 1931.
Destra: Il triangolo mostra la cromaticità di tutti i colori ottenibili per sintesi additiva dei primari RGB CIE 1931. |
| Date | |
| Source | Own work |
| Author | Magica |
Licensing[edit]
I, the copyright holder of this work, hereby publish it under the following license:
This file is licensed under the Creative Commons Attribution-Share Alike 4.0 International license.
- You are free:
- to share – to copy, distribute and transmit the work
- to remix – to adapt the work
- Under the following conditions:
- attribution – You must give appropriate credit, provide a link to the license, and indicate if changes were made. You may do so in any reasonable manner, but not in any way that suggests the licensor endorses you or your use.
- share alike – If you remix, transform, or build upon the material, you must distribute your contributions under the same or compatible license as the original.

|
This media file is uncategorized.
Please help improve this media file by adding it to one or more categories, so it may be associated with related media files (how?), and so that it can be more easily found.
Please notify the uploader with {{subst:Please link images|File:CIE 1931 Chromaticy Diagram and Gamut.jpg}} ~~~~ |
File history
Click on a date/time to view the file as it appeared at that time.
| Date/Time | Thumbnail | Dimensions | User | Comment | |
|---|---|---|---|---|---|
| current | 23:06, 2 April 2020 | | 2,564 × 1,396 (368 KB) | Magica (talk | contribs) | Uploaded own work with UploadWizard |
You cannot overwrite this file.
File usage on Commons
There are no pages that use this file.