Air Quality
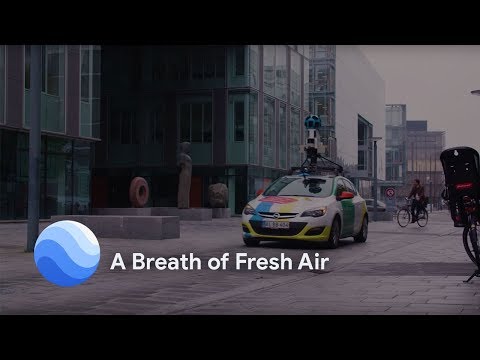
Clean air is critical to life on Earth, yet over 90 percent of the world’s population breathes polluted air. For the past several years, Google has equipped several of our Street View vehicles with air pollution sensors in order to measure street-by-street air quality on our city streets. We’ve been working with partners around the world to make over 500 million air measurements. Our hope is that cities will be able to use this information to make more informed decisions and accelerate efforts in their transition to a healthier, more sustainable city. These measurements can make the invisible, visible, so that we can all breathe better and live healthier.
Dublin
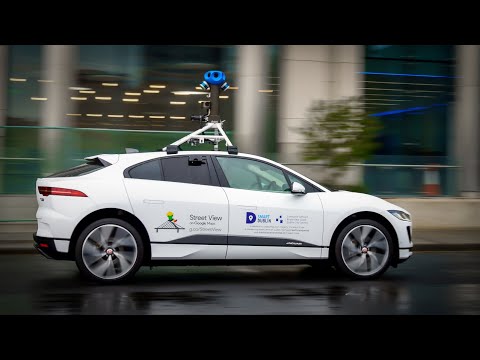
We are collaborating with Dublin City Council as part of its Smart Dublin programme, to produce hyperlocal air quality data insights that will help the Irish capital gain additional knowledge and support their actions to improve the City’s climate and health. This is the next phase of Dublin's partnership with Google’s Environmental Insights Explorer (EIE), to inform smart transit programs with the goal of reducing emissions and increasing the use of cleaner modes of travel. The initiative will see Google’s first electric Street View car, a Jaguar I-PACE, deployed around the city measuring air quality for a year, using Aclima’s specialised mobile air sensing platform that can measure and analyse nitrogen dioxide (NO2), nitrous oxide (NO), carbon dioxide (CO2), carbon monoxide (CO), fine particulate matter (PM2.5) and ozone (O3); pollutants which at high levels are harmful to the climate and human health. In Ireland, this is the first time a Google Street View car has been used to capture air pollution and greenhouse gas measurements in addition to Google Maps Street View imagery, a feat possible due to the integration of Google’s Street View technology into the vehicle by Jaguar Land Rover engineers.
Air quality maps launched in Environmental Insights Explorer
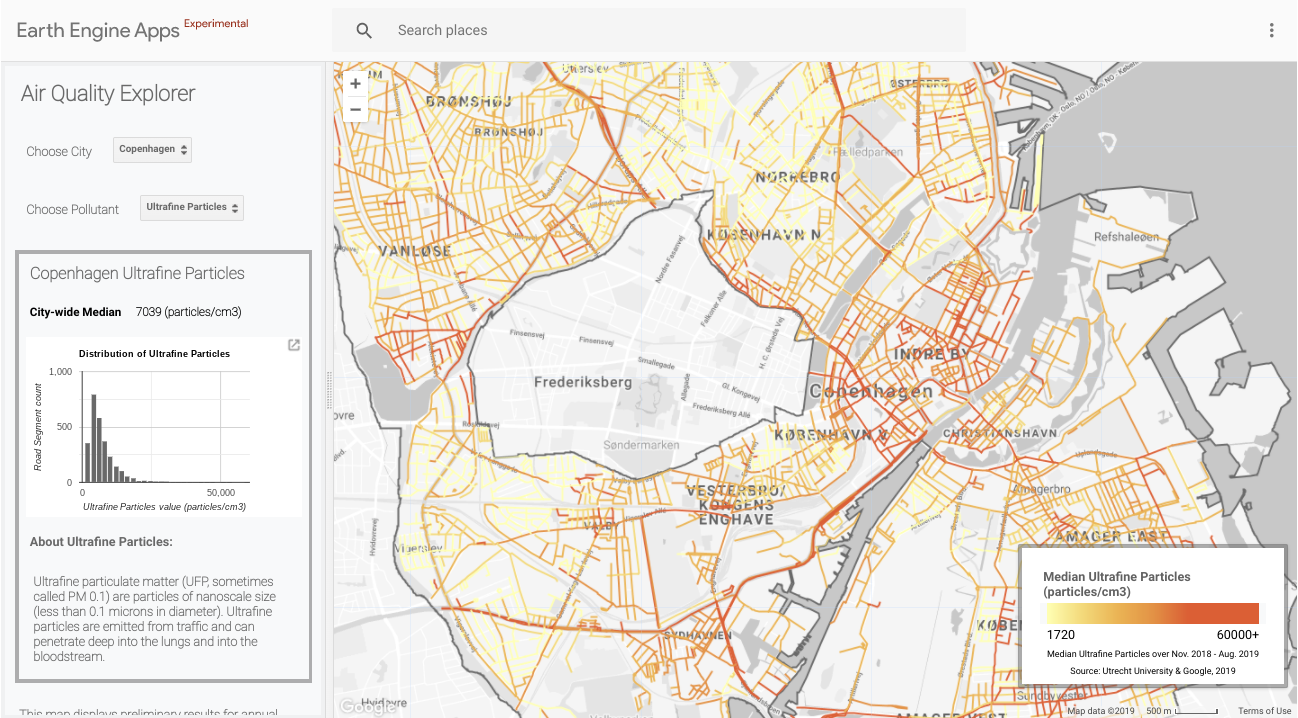
In October 2019, we published new hyperlocal, street-level air quality insights on our Environmental Insights Explorer, starting in Copenhagen and London. This is part of a new section called EIE Labs, which will pilot climate-focused datasets as a critical indicator for prioritising and tracking climate action. We’re creating Copenhagen’s new air quality map in partnership with the City of Copenhagen and scientists at Utrecht University, bringing in data from Google Street View vehicles with scientific instruments to measure air quality at street level. The preliminary map shows the block-by-block concentration of black carbon and ultrafine particle pollution, which Copenhagen is already using to work with architects and designers to rethink the city for the future.
In London, in partnership with the Breathe London project, we published new air quality maps of fine particulate matter (PM 2.5) and nitrogen dioxide.

Amsterdam
In May 2019, we announced that we are partnering with the City of Amsterdam to gain insight into the city’s air quality at the street level. Two Street View cars have been equipped with air sensors to measure nitric oxide (NO), nitrogen dioxide (NO2), particulate matter (PM 2.5, PM 10), ultrafine particulate matter (PM 0.1) and black carbon. Scientists from the University of Utrecht have equipped the air sensors into the vehicles, and are working with the City and Google to plan the routes for driving and lead the data validation and analysis. Once the data validation and analysis is complete, our goal is to share helpful insights with the public, so that everyone – citizens, scientists, authorities and organisations – can make more informed decisions.
Copenhagen
In October 2018, we launched that we are partnering with the City of Copenhagen and Google to gain insight into Copenhagen’s air quality at the street level. With the City of Copenhagen, we’ve enlisted the help of scientists from the University of Utrecht in The Netherlands to equip the car with air quality equipment. They will also play an integral part in data validation and analysis. Aarhus University in Denmark will also contribute.
London
In 2018, we announced that we are partnering with Environmental Defense Fund, Greater London Authority, C40, Air Monitors, National Physical Laboratory, Cambridge Environmental Research Consultants and other research partners, as part of the Breathe London Project. We began driving two specially equipped Google Street View cars through the capital to measure air pollution, in an effort to gather and analyse millions of measurements over the course of 2019.
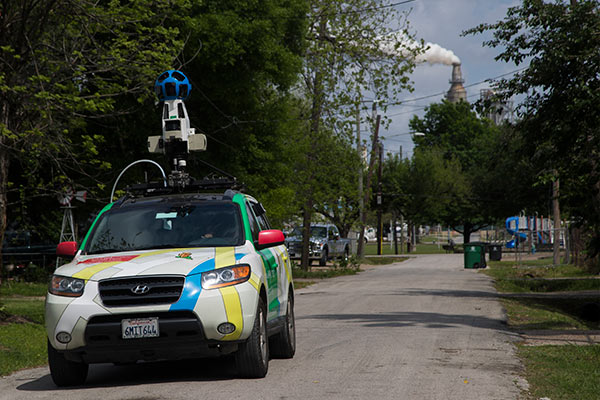
Houston
In 2018, we partnered with Environmental Defence Fund (EDF), along with researchers from Rice University and Sonoma Technology, and drove two Google Street View cars outfitted with a suite of air monitoring equipment around Houston neighborhoods from July 2017 through March 2018. This project in Houston brought a more diverse mix of pollutants and a combination of commercial and industrial activity with residential areas.
Oakland
In 2017, with our partners at Environmental Defence Fund (EDF), Aclima, and University of Texas-Austin, we shared the first results of an endeavour we started in 2015: to measure air quality using Google Street View cars. You can now see maps for Oakland, California, released by EDF, of nitric oxide (NO), nitrogen dioxide (NO2) and black carbon – pollutants emitted from cars, lorries and other sources that can affect our health and our climate.
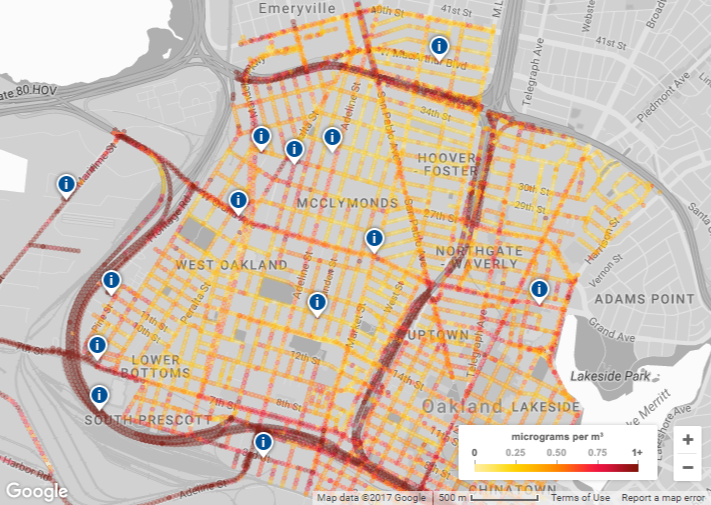
Scientists can request access to the validated data now. You can also learn more about the science behind these maps in the journal Environmental Science & Technology, by a scientific team led by Dr. Joshua Apte, at the University of Texas-Austin.
Our plans to expand
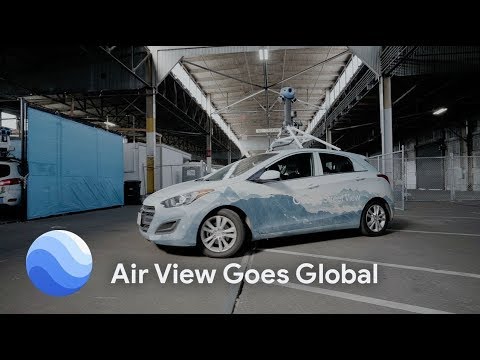
Along with Aclima, we've been testing air quality equipment with the goal of fine-tuning their mobile-friendly air sensors to a point where they deliver accuracy comparable to laboratory-grade instruments. After years of effort, we announced in September 2018 that we achieved this goal, and that we will expand our air quality mapping to 50 more Street View cars in more places around the globe.
During our initial research phase, Google and Aclima tested air quality equipment on a few Street View cars. Each car was installed with two sets of instruments: the first set contained laboratory-grade air quality reference instruments that are typically used for government air quality monitoring. This equipment is expensive and big, so it’s hard to deploy on a large number of vehicles. The second set had Aclima’s smaller, more mobile-friendly, air sensors that enable us to deploy in higher numbers. With both sets of equipment side-by-side, we've been able to validate their performance, and we’re now confident that the smaller Aclima sensors are ready to be deployed in 50 Street View cars.
Methane Mapping
Project Air View started back in 2014, when we announced that we were working with the Environmental Defence Fund (EDF) to map thousands of methane leaks from natural gas lines under select US city streets using Street View cars equipped with methane analysers. In 2016, one of the largest US utilities, PSE&G announced that they used data and maps from our Street View mapping effort to prioritise the replacement of gas mains, as part of their approved multi-million dollar pipeline replacement programme. This enabled them to reduce methane emissions from targeted areas by 83 per cent, by replacing 35 per cent fewer miles of pipe than if the utility had not used the data. See EDF's site (which goes into the bigger picture of what this means), and see the scientific work that has been published in the journal Environmental Science & Technology.